Embedding Charts in Reports
Description
To embed a chart in a report, first create a new Quick Report, then save it as a Layout Table Report, using the Open in Report Editor button. In the Layout Table Report Designer, add a row to hold the chart, enlarge the row and merge enough cells to make room for the desired chart size, and add the chart to the layout by double-clicking in the large cell to bring up the Cell contents dialog.
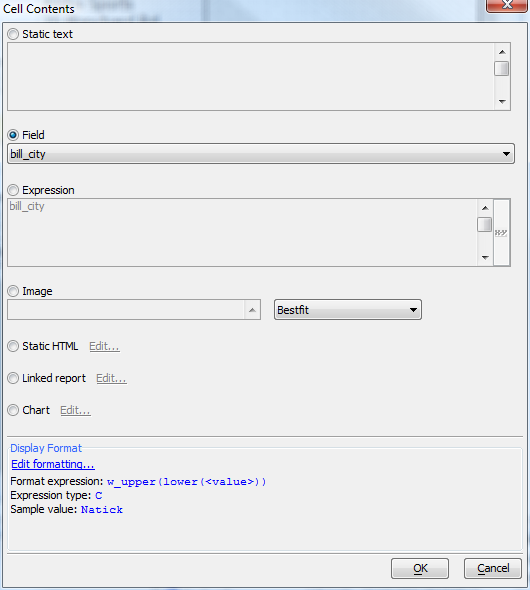
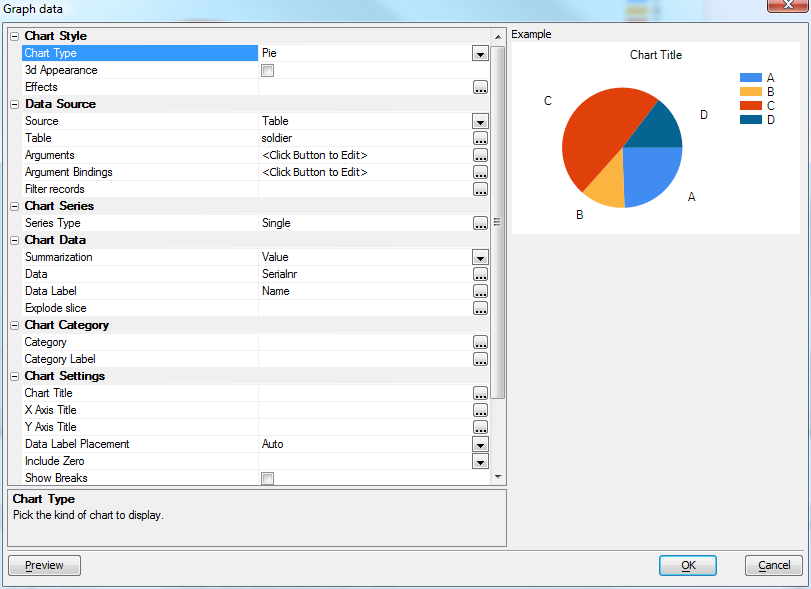
Select the Chart radio button, click Edit..., and design your chart using the control. All the variables and summaries in the report and its underlying data will be available to the chart.
Videos
Reports - Embedded Charts
R1. This video shows how charts can be embedded into an Alpha Anywhere report.
Reports - Adding a Chart to the Sample Invoice Report
R2. In Video R1 we showed how you can add a chart to a report. In that video, the data source for the chart was set to 'Table'. In this video we show how a chart can be added to the sample 'Invoice' report in the sample 'AlphaSports' application that ships with Alpha Anywhere. In this video, the data source for the chart is set to 'Report', which means that the data used in the report is used for the chart, rather than a separate query. By setting the data source to 'Report' the chart can use all of the calculated fields and summary fields that the report calculates.
See Also